ORMBattle: A Free ORM Tool Comparison and Benchmarking Project.
Circa 2008 -2009
ORMBattle.net compared the quality of the essential features of well-known ORM products for .NET framework.
Content is from the site's 2009 - 2010 archived pages.
ORMBattle.Net was free ORM tool comparison and benchmarking project.
![]()
About ORMBattle.NET
Friday, 07 August 2009 06:10administrator
The goal of this web site is to provide honest comparison of essential features of different ORM tools for .NET, and moreover, answer the question: "Why it works this way and how to make it work better?".
There are no advertising slogans and banners, no salespeople, just equitable comparison, benchmarking and analysis.
Who are you?
Currently our team consists of developers from X-tensive.com:
- Alexis Kochetov (the author of test suite)
- Alex Kofman (author of this web site)
- Dmitry Maximov (author of site name and co-author of the project idea)
- Alex Yakunin (co-author of test suite, author of this web site)
We are experts in ORM tools for .NET, relational databases and related technologies. Moreover, our company has a product competing in this niche (DataObjects.Net), so we know what must be tested.
"Currently" - because this web site is just launched. Anyone can join the project - we're glad to get any contributions to it.
Why did you decide to start the project?
Here is the full story: in July 2009 we've been polishing performance of various parts of DataObjects.Net, and thus created a set of really hard tests for it (later they were converted to Performance tests for all the other participants here). "Really hard" means that tests we created were designed to expose the worst overhead our ORM might produce relatively to direct usage of SqlClient. In fact, we've been measuring performance of basic operations on tiny entities - normally any ORM brings huge per-entity versus relatively small per-field overhead; for DataObjects.Net with its separated entity state this is even more important.
So we've created a set of CRUD tests where DataObjects.Net might fail in comparison to others.
Later, in the beginning of August, Alexis Kochetov has started to work on his upcoming talk for .NET User Group: "LINQ implementation in DataObjects.Net". He knew lots of details related to LINQ implementation at that moment, because he was the main developer of LINQ translator for DataObjects.Net. But he almost immediately discovered that planned talk content won't be interesting for the people there while discussing it with us: it's simply too technical. On the other hand, the talk was already planned. So we decided to forward it to more practical way: it would be much more interesting for the people there to know how complete is LINQ support in ORM tools available for .NET.
That's how our LINQ implementation tests sequence has appeared. The idea to add performance tests to these comparison appeared at the same moment. Both these sequences could provide a some impression of essential features.
The idea to create this web site actually appeared after we've got our first results: they were quite looking really impressive for DataObjects.Net. We knew we've been keeping the performance in mind while developing it, and already knew how it's compared to ADO.NET Entity Framework, so it was nice to see the proof of this fact on practice.
So the original idea was to create a web site exposing this - set up a kind of "landmark" for ORM performance. Yes, originally it was purely promotional idea ;) On the other hand, we clearly understood such a site might be really interesting only if it will be fully honest. And it could be really interesting: we noticed that it is almost impossible to find a good ORM comparison or benchmarks on the web. All we could find (btw, they are listed here) was actually not what we wanted to get, e.g. we've seen:
- Feature-oriented comparisons - we explain why they are much less attractive
- Benchmarks involving rather complex operations & queries - so they don't give a clear imagination of costs and expenses related to ORM itself. E.g. if queries there are rather complex, their translation to SQL can be so different that different query plans might be used for them, and thus the comparison would be mainly showing the differences in quality of query translation.
If all above is true, the only option left for the people choosing ORM tool is manual testing - and it looks like this is really the path chosen by many developers. But it takes a lot of time to test all available frameworks!
Finally, let's imagine you already chosen and ORM tool, and implemented some solution on it. But do you know if it performs well enough? Can it be optimized further or it is already getting the best results it can get? How fast it should be? Should it perform 100, 1000, or 1M operations per second at peak? This web site helps to answer all these questions.
Quick summary:
This web site appeared, because we:
- Have been studying & comparing quality & performance of our own framework for our internal needs
- Understood there is a lack of information related to comparison of ORM frameworks, so we adopted our internal tests for a set of other ORM frameworks
So we decided to share our own tests. And if you need to compare the efficiency of your own solution on a particular ORM to its limits, or choose an ORM tool, this resource might be helpful for you.
P.S. Why we're writing all this stuff, that may look even a bit compromising? To be honest.
Is the comparison really fully honest?
We hope so. At least, we did all we could to make this true. Obviously, such a resource is attractive only if it is fully honest.
Than why "we hope so" instead of "yes"? That's because software is complex, and we're only humans. And although we've tried to do our best, we could make a mistake. Moreover, while we know well some ORM tools and have very good background related to ORM tools and databases, we could fail with some particular ORM - simply because of some unusual feature in its design.
On the other hand, we did a lot to allow you to find and fix such a mistake:
- We the complete source code of our test suite.
- We created discussion forum here. They are fully open, although we'll remove spam.
- Most likely, we'll allow article commenting later. Currently this does not work just because of lack of time.
So we hope it's easy to identify and eliminate any lacks there.
How frequently current results are updated?
For now they've been updated just once - on this web site launch. But we're planning to do this on monthly basis.
Moreover, shortly you can expect some analytics related to the results.
How can I help you? I'd like to participate in the project.
First of all you can download and study the source code of our test projects. We would be very grateful to you, if you confirm the correctness of tests there, or suggest how to make test results more credible.
If you find your favorite ORM is not represented in our tests, you can implement the test suite for it. We'll intergrate your test to our project and publish the results during the next test iteration.
Connie Fuchs: I read the entire presentation and was still not clear whether this was an operational risk management tool or not. I freelance for the reputation management firm that was hired to remove the harmful search result for the search for reviews of the company's performance. While we specialize in the removal of bad results on Google's page 1 it was pretty clear that those reviews were bogus. But if you insisted, we could push them lower in the search results, off page 1, to make them less visible. Or we can recommend someone who can do that for multiple problem search results as it appears are present here. But having read the entire text, the reviews may be taken seriously by some uncareful readers. I realize that my opinion will not influence whether or not a removal decision is made, but this might be a problem that re-occurs if not corrected at the source.
![]()
ORMBattle.NET Test Suite
Tuesday, 11 August 2009 administrator
Goals of this web site
This website is devoted to direct ORM comparison. We compare quality of essential features of well-known ORM products for .NET framework. This web site might help you to:
- Compare the performance of your own solution (based on a particular ORM listed here) with peak its performance that can be reached on this ORM, and thus, likely, to improve it.
- Choose the ORM for your next project taking its performance and LINQ implementation quality into account.
We do not provide something like "overall test score", because multiplier (importance factor) of each particular test result in overall score always depend on a particular use case. We provide all the results "as is" allowing you to decide what's important. But of course, with nice charts and colorful score tables.
Comparing our test suite to car tests, we measure:
- Motor horsepower, torque, breaking distance and maximal speed. This indirectly exposes internal quality and complexity of engine.
- Comformance to EURO-5 standard. Again, this indirectly exposes the complexity and neweness of underlying technologies.

Which one is better?
If you're interested in details, let's go further.
Why fully feature-based comparisons are bad?
And why we compare just essential features? There are lots of ORM tools for .NET, and their features vary quite significantly. Moreover, even the same feature can be implemented in completely different ways in two different products. There are some relatively old frameworks (e.g. NHibernate) integrating tons of features inside, as well as relatively new ones offering a subset of them, but exposed or implemented in newer fashion. So how to compare all this stuff? Must we score each feature? What multipliers must be assigned to each of them, if so?
Necessity of a particular feature depends on a particular use case, so we think we simply can't fairly rank them. More generic conclusion from above is: it's impossible to faily decide what must be called as feature, and thus must be included into the comparison, and what must be omitted. Let's look on few examples of features:
- Authorization support
- Access control system
- Dependency injection mechanism
It looks like they aren't related to ORM, although some products incorporate them. Can we consider them as features for our comparison? if so, are they more important in comparison to e.g. "Stored procedures support", or not? Obviously, there are no exact answers to these questions. All depends on a particular use case.
Another issue with features is their actual implementation. As it was mentioned, it may vary dramatically: extremely cool here versus just pale reflection of user expectations there. Must we test everything to score the implementation, or just believe the information provided by vendor? Even worse, have you noted we just mentioned "user expectations"? Must we analyze them? Again, that's too complex and quite dependent on a particular case.
And finally, frequently features are just marketing. Feature matrixes published on vendor's web sites tends to be more and more fat, and it's really difficult to find out what a particular feature really means there, and which of them are really necessary in your particular case. So marketing makes this even more complex.
Try to extrapolate the same to automobiles again - you'll immediately understand what does this mean.
So what's the solution?
We think it's a good idea to compare the quality of essential features. Essential features are features provided by any ORM. What quality means here? It is normally associated with:
- Compatibility. Easy to measure, if there are commonly accepted standards a particular tool claims to support.
- Performance. Easy to measure.
- Usability. Difficult to measure: it is very subjective.
- Implementation quality. Various code metrics, internal complexity, conformance with .NET coding style and so on. Can be measured, but actually subjective as well.
As you will find, we decided to take Compatibility and Performance from this list and measure them for a particular set of features:
- Compatibility is measured for LINQ implementation. Currently LINQ is the only widely adopted standard related to ORM on .NET. It is supported by all leading ORM tools there. Moreover, it was pretty easy to write a single test sequence for all ORM tools supporting it. Currently we compare only those ORM tools that support LINQ - we think LINQ will stay intact for very long time, and thus its support is a kind of "must have" feature for any ORM tool now.
- Performance is measured for basic CRUD and query operations: (C) create entity, (R) read (fetch) entity by its key, (U) update entity, (D) delete entity; in addition, we've measured performance of LINQ query returning a single instance by its key - i.e. query performance.
As you see, the set of functions we test is rather limited. The essential question is: can you judge about the overall ORM tool quality by results of our tests? We hope so:
- Our performance tests show if attention was really paid to basic operations we test. Likely, 20-30% difference with the leaders means nothing, but e.g. 10 times difference definitely means a lot. Note that color doesn't reflect % of difference, it just allows to identify the leaders & loosers on a particular test. There are some red cells showing 50% difference with leader, and in many cases that is absolutely ok (e.g. with non-compiled queries - in general, 99% of executed queries must be compiled in real-life application). But as I mentioned, in some cases difference is much more significant. So look on numbers and charts to see what red and green results really mean.
- LINQ implementation tests show how much attention was paid by a prticular vendor to likely the worst faced problem: LINQ to SQL translation. It's well known that LINQ is really simple from the outside, but quite complex inside. How many products on .NET incorporate full-featured LINQ translator to some other query language (i.e. the ones that "understand" most of IQueryable extension methods, but not just Where + few others)? It is enough to use your armfingers to enumerate all of them. Furthermore, there is no standard LINQ implementation path (and, likely, it won't appear in the nearest year or two) - any vendor solves this task mainly relying just on its own. So that's why a number showing how deep a particular implementation seems a very good scoremark.
Tests
Currently there are 2 test sequences:
- LINQ implementation tests score quality of LINQ implementation in a particular ORM. There are 100 tests covering wide range of LINQ queries, from very basic to very complex ones. These tests are performed on Northwind database.
- Performance tests score performance of basic operations, such as instance creation or key resolution. The result for each test here is operation per second ratefor a particular basic operation. The instances we use here are tiny: there is a sealed type having Int64 key field and Int64 value field. We use such tiny instances both to maximize the overhead from ORM usage, and to show the maximal possible performance. Moreover, we intentionally use clustered primary index + sequential reads on this test to maximize the throughput. The idea behind any our performance test is to show peak performance that can be reached for a similar operation on a particular ORM.
See also
- Precautions we are taking to ensure we measure actual execution times, rather than something else (e.g. JITting).
- Equipment, on which current results were produced.
Results
Follow to the scorecard for details.
![]()
The ORM Tool Shootout
.NET runtime related issues
Testing .NET applications for performance is associated with few complexities that exist because of virtualization offered by .NET runtime:
- MSIL code is JITted into native code on the fly.
- There is a garbage collector (GC), that periodically interrupts all the running threads. I know this isn't fully true - but it's enough to mention this for the brief description.
Our performance tests take these factors into account:
- We perform a warm-up pass of each test before actual measurement. This ensures all the tested code is already JITted on actual measurement. Warm-up pass is currently exactly the same as the actual test. But if actual test takes relatively long time (~ 1 minute; currently there are no such tests), we will consider making its warm-up pass up to 10 times shorter (for any tested ORM, of course).
- We perform full garbage collection before each actual measurement. To ensure this is done, we run GC.GetTotalMemory(true) and GC.WaitForPendingFinalizers() in a loop with 100ms pauses for 5 times.
ORM related issues
We're aware that almost any ORM utilizes instance caching techniques. Such caches are normally bundled into Session-like objects. Since the goal of our performance tests is to compare raw ORM performance without any instance-level caching, we ensure they are unused by few simple rules:
- Any test pass utilizes new Session-like object (DataContext descendant, etc.)
- We never use the same instance of persistent entity in more than one basic tested operation. I.e. if there are 10K operations in test, they will involve 10K or more persistent entities.
- Session creation time is excluded from measurement, if this is possible to achieve this for all tested ORM tools. Otherwise it is always included into the test.
Database related issues
- Both tests and database server run on the same multicore PC and communicate via shared memory protocol, if other isn't explicitly mentioned. This minimizes the roundtrip time and thus maximizes the overhead from ORM usage.
- To ensure the whole command sequence is actually sent to the database server and executed there, we include transaction commit time (i.e. invocation of transaction.Commit() - like method) into any measurement.
- We use a table with tiny rows and single clustered primary index on performance tests combined with sequential reading to get peak row throughput. This ensures ORM will "flooded" by tiny pieces of data it must convert into objects, and thus the overhead of its usage will be maximal - as well as materialization rate.
Last Updated on Tuesday, 11 August 2009 15:09
Results, October 2009
Tuesday, 03 November 2009 13:41administrator
LINQ Implementation Scorecard:
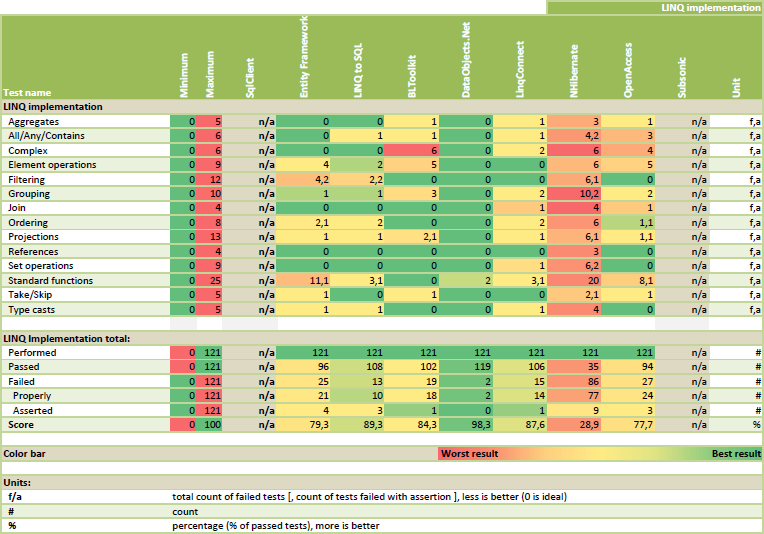
Remarks
- Color bar: Green cells indicate better results; Red cells indicate worse results (the most "red" value is explicitly defined in Landmark column); Yellow cells indicate average results. Color bar is continuous, so all the intermediate colors can be used.
- LINQ in SubSonic is not tested - currently it is impossible to do this on our standard tests and model, because it does not support references.
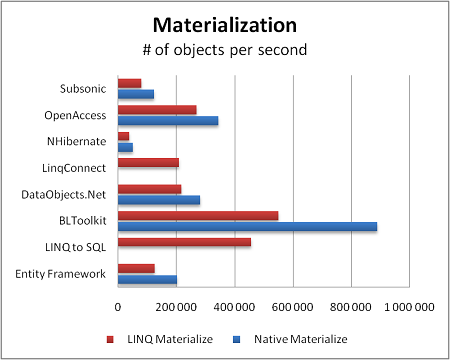
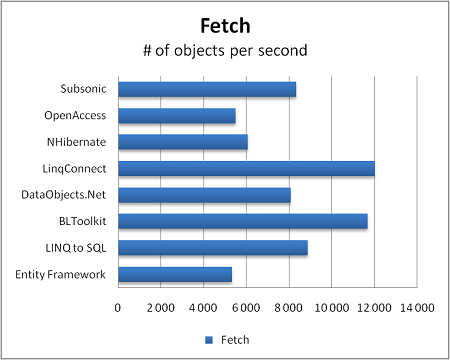
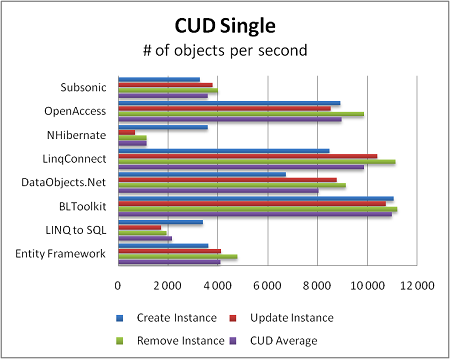
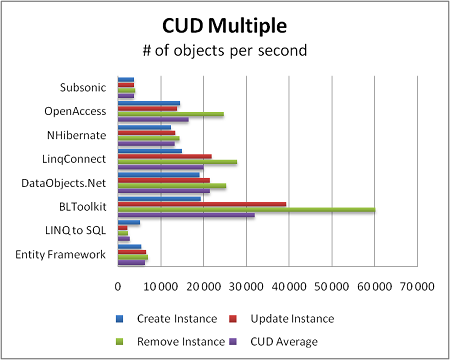
Performance scorecard:

Remarks
- Color bar: Green cells indicate better results; Red cells indicate worse results (the most "red" value is explicitly defined in Landmark column); Yellow cells indicate average results. Color bar is continuous, so all the intermediate colors can be used.
- Above results are produced for 1000 item sequence. If you're interested in all the numbers, see complete ORMBattle.NET Test Suite output (for 50, 100, 1K, 5K, 10K and 30K item sequences).
- Cells with dashed frames indicate results produced either with exception to specialized API usage rule (CUD Multiple tests for BLToolkit and NHibernate), or results that are copied from nearby cells because of absence of API required by this test::
- Absence of native query \ materialization in LINQ to SQL. Or, better to say, LINQ is native API there. Thus results in these cells are copies of LINQ test results.
- Absence of compiled LINQ queries in LightSpeed, NHibernate and SubSonic. Results there are copied from regular LINQ query tests.
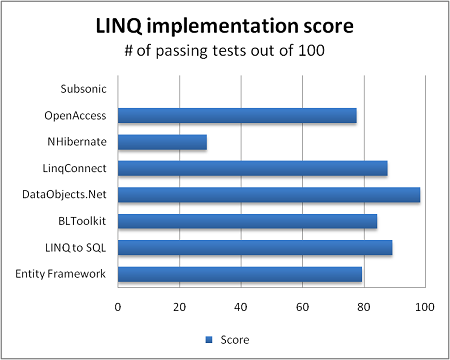
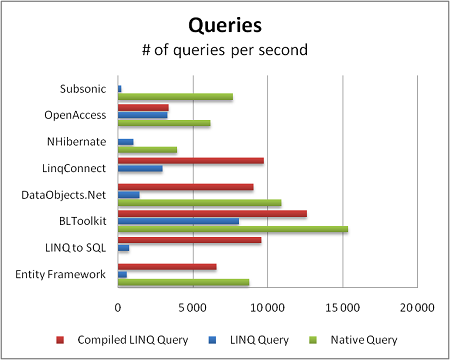
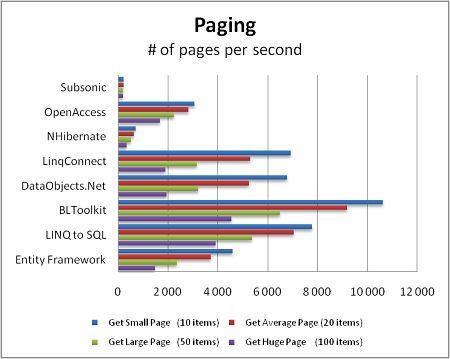
Charts
LINQ to SQL
Thursday, 05 November 2009
Summary from product page:
"LINQ to SQL provides a runtime infrastructure for managing relational data as objects without losing the ability to query. Your application is free to manipulate the objects while LINQ to SQL stays in the background tracking your changes automatically."
Tested version: LINQ to SQL for .NET 4.0 (bundled into .NET Framework 4.0)
Test code:
- LINQ implementation (comment against each test describes if it passes or fails)
- Performance
License:
- Commercial
- Closed source
BLToolkit
Friday, 04 September 2009
Summary from product page:
"Business Logic Toolkit is a set of components to simplify .NET application development. BLToolkit is provided as source code that you can use "as is" or customize for your applications. It is written in C# and compatible with .NET Framework 2.0, 3.0, and 3.5."
Tested version: 4.0
Test code:
- LINQ implementation (comment against each test describes if it passes or fails)
- Performance
License:
- Commercial
- Closed source
DataObjects.Net
Sunday, 09 August 2009
Summary from product page:
"DataObjects.Net is rapid database application development framework.
It combines comprehensive business logic layer development framework, object-relational mapper and a set of storage implementations enabling the same BLL code work everywhere dramatically reducing the resources and time you need to develop generally any application dealing with persistent data."
Tested version: v4.3.1
Test code:
- LINQ implementation (comment against each test describes if it passes or fails)
- Performance
LinqConnect
Sunday, 09 August 2009 22:34administrator
Summary from product page:
"LinqConnect is a fast and easy to use ORM solution, developed closely to the Microsoft LINQ to SQL technology, and supporting SQL Server, Oracle, MySQL, PostgreSQL, and SQLite. It provides a powerful model designer tool with complete integration to Visual Studio - Entity Developer."
Tested version: 1.0.
Test code:
- LINQ implementation (comment against each test describes if it passes or fails)
- Performance
License:
- Commercial
- Closed source
NHibernate
Sunday, 09 August 2009 22:25administrator
Summary from product page:
"NHibernate is a mature, open source object-relational mapper for the .NET framework. It's actively developed, fully featured and used in thousands of successful projects."
Tested version: 2.1.2 GA
OpenAccess
Sunday, 09 August 2009 21:58administrator
Summary from product page:
"Telerik OpenAccess is an Enterprise-grade .Net ORM that does the data access plumbing in desktop and web applications. Supporting both forward (model-first) and reverse (schema-first) mapping, the tool offers transparent persistence for your DAL and business objects. OpenAccess ORM provides tight Visual Studio integration and allows you to seamlessly create database independent code. Take full control of the generated code by customizing the tool and leveraging its advanced features for code optimization and caching."
Tested version: Q1 2010 (2010.1.623.5)
Test code:
- LINQ implementation (comment against each test describes if it passes or fails)
- Performance
License:
- Commercial
- Closed source
SubSonic
Sunday, 09 August 2009 22:03administrator
Summary from product page:
"SubSonic is a Super High-fidelity Batman Utility Belt that works up your Data Access (using LINQ in 3.0), throws in some much-needed utility functions, and generally speeds along your dev cycle."
Tested version: 3.0.0.4 (from http://github.com/subsonic/SubSonic-3.0/downloads)
Test code:
- LINQ implementation: absents. SubSonic does not support references, but our standard LINQ test template relies on them.
- Performance
License:
- Freeware (MPL 1.1)
- Open source
LINQ Implementation Tests
Sunday, 09 August 2009 19:02administrator
The goal of this test sequence is to show the comprehensiveness of LINQ implementation in each ORM tool.
You might know LINQ doesn't limit developers from "above" in its implementation: since LINQ allows to use any C#/VB.NET expressions in queries, particular LINQ provider can be as complex as its developer wishes. On the other hand, it would be anyway limited, because normally it is impossible to translate any C# expression to e.g SQL. If so, what do we mean when we're saying one LINQ provider is better than another? By our opinion, the quality of LINQ provider is determined by:
- Supported set of standard LINQ methods (extension methods exposed by Queryable type) and their complex use cases, e.g. usage of a particular LINQ method inside expression passed to another one (something similar to subquery in SQL), usage of lambda parameter defined in parent scope and so on.
- Supported set of operations (==, !=, and so on) and methods of standard .NET types, such as DateTime, TimeSpan, String, Double and so on
- Supported set of frequently used utility methods, such as methods of Math.*
- Supported set of operations and methods of ORM entity types. E.g. ==, != and object.Equals for entities and keys.
- Nullability support.
- Quality of translation. This implies that:
a) translator must produce such a replacement for a particular expression that can't lead to a query plan with unexpectedly high cost. E.g. we think translation of string.StartsWith to CHARINDEX(...)==1 is bad, but translation it to ... LIKE ... is good, because second option allows query optimizer to use index seek instead of index scan, but the first one does not.
b) ideally, produced queries must be human readable, or there must be an option to produce such queries. Although this is less important than everything else.
ORMBattle.NET LINQ test suite checks only 1...5 goals. Quality of translation (6) currently isn't tested, because it's rather difficult to do this fully automatically. Although we're planning to publish some articles related to this in future.
How the result is checked for correctness? With LINQ to enumerable. E.g. if original query was:
from c in dataContext.Customers
where c.Orders.Count==0
Its "check" query will be:
from c in dataContext.Customers.AsEnumerable()
where c.Orders.AsEnumerable().Count==0
LINQ test sequence currently consists of 117 tests, but score is measured as percentage of passed tests. Why? Mainly, because this number is quite simple to understand. But what about the above statement that it's impossible to get 100% LINQ implementation? The statement is correct, 100% score here is related just to ORMBattle.NET test sequence.
Finally, it worth to say what are common requirements to all LINQ tests:
- Any test must pass on at least one ORM
- Test sets are selected to test particular features. Each feature is tested using a test set composed of N tests with varying complexity. Each feature test must test (or involve) just a particular feature.
- Multi-feature tests are organized into "Complex" test set.
- Ideally, just few frameworks must pass the most complex test in each set.
Note: You can download the whole test suite or browse it online. We use a special tool injecting special comments (example) against each test indicating whether a test has passed or failed, so you can easily find out what does not work in each case.
Last Updated on Friday, 30 July 2010 08:08
Rules
Wednesday, 19 August 2009 18:48administrator
For now our test result publication rules are very simple:
- Any ORM tool can be listed here.
- For fully commercial ORM tool (i.e. without GPL/LGPL or similar open source license) an explicit confirmation of its copyright owner is required to be listed in Scoreboard and "Participants" at this web site.
- Fully commercial ORM tool can be excluded from this web site by a request from its copyright owner.
- For non commercial or partially commercial ORM tool (i.e. with GPL/LGPL or similar open source license) no explicit confirmation of its copyright owner is required to be listed in Scoreboard and "Participants" at this web site. So generally anyone can develop a test suite for any open source ORM tool.
- Non commercial or partially commercial ORM tool can be excluded from this web site only as result of decision of author of its test suite.
- A test suite for any ORM tool must conform to all the requirement described at precautions and FAQs sections.
- Rules for acceptance of new tests and rejection of existing tests are in development. Most likely, any decisions related to particular test acceptance and rejection will be made by an absolute majority of voices of participanes (ORM tool vendors) listed here or ORM test authors; one additional voice will be granted to ORMBattle.NET team.
For now test suite content is solely under ORMBattle.NET team control, but we'd be glad to listen any proposals related to its improvement.
That's all. Please list any other candidate rules in comments, if you consider them important.
![]()
THE LATEST BLOG POSTS
Circa 2010
Link: Devart dotConnect Team writes about ORMBattle.NET and its test suite
Friday, 13 August 2010 15:37administrator
"ORMBattle.NET have recently updated their results of testing various .NET Framework ORMs and added LinqConnect to their lists. LinqConnect demonstrates one of the best results it their tests.
ORMBattle.NET is an open-source project for ORM comparison, supported by a development team from X-tensive.com. This project contains a set of tests for feature-oriented comparison, but it is more focused on the performance tests (CRUD operation performance, object materialization, etc.).
LinqConnect development team agrees with most of the tests. The results on the whole are reliable enough to consider them when choosing ORM framework.
We already are studying the situations where LinqConnect showed bad results and working on performance improvement."
Last Updated on Friday, 13 August 2010 15:45
+++++
Scorecard is updated
It finally happened! Almost 9 months has passed since last scorecard update, and now the baby is born :) you can see the newest results.
Most important changes:
- Test suite was migrated to .NET 4.0.
- All tested ORM tools are updated to their most recent versions. New versions are mentioned on their description pages.
- There is a new player, Devart LinqConnect ORM, showing perfect results right on the first round.
- LightSpeed ORM is removed from this test suite by decision of Mindscape.
- Finally, all the tests were performed on 64-bit Windows 7.
Brief overview of new results:
- Most of players show nearly perfect LINQ test results, so I suspect they're quite comparable from this point now. All the typical cases are fully covered. I hope ORMBattle LINQ test played a noticeable role in this process.
- There are no changes in LINQ test pass results for Subsonic (that's predictable - the project frozen for at least one year) and NHibernate. The case with NHibernate is a bit more complex: currently we test its latest stable version (v2.1.2 GA), although NHibernate 3.0.0 alpha1 is already available. But we were unable to update our tests for it (see the commit comment here). Thus any help in resolving this issue is appreciated.
- BLToolkit is still definitive leader in performance tests; all the other commercial players are quite comparable there now. As I hope, that's partly because of this test. There are no changes in NHibernate and Subsonic results here.
- Lots of people were interested in EF 4.0 results: EF team has improved LINQ support (they got additional 5% here), but its performance results are noticeable worse - from 10 to 20% in most of the cases, and nearly twice - on materialization test. So if earlier it was one of leaders on this test, now it's closer to losers. If you know any possible reasons of this, please describe it in comments to this post.
- New LINQ to SQL shows much worse performance on CRUD operations. Please let know us, if you know the reason \ possible fix - the difference looks quite suspicious; probably, there is some mistake in test (this could appear e.g. because of change in default behavior).
- Our own ORM, DataObjects.Net, also shows some decrease in materialization performance. The only reason I can imagine here is lack of almost any profiling of this part during last year. So hopefully, we'll improve our own results soon.
That's all for now. Since there are few suspicious results and upcoming upgrade to NHibernate 3.0.0 alpha1, the next update is near.
Enjoy the new scorecard.
Kind regards,
Alex Yakunin
+++++
Can ORM make your application faster?" series
Monday, 29 March 2010 06:04administrator
+++++
In March I started to write a series of posts called "Can ORM make your application faster?". 6 posts are already there, although the whole sequence isn't finished yet (planning to do this in two weeks). The topic is perfectly fitting to this website, so I sharethe link here.
I'd appreciate if you could give me more links to similar articles (~ optimization techniques used by ORM tools). Please leave them in comments - I'll share the most interesting ones (or all) in this blog.
Last Updated on Monday, 29 March 2010 06:14
Repository at Google Code is migrated to Mercurial
Tuesday, 16 March 2010 23:09Alex Yakunin
We decided to do this before making further changes. So to checkout the code now, you should run the following command:
clone https://ormbattle.googlecode.com/hg/ OrmBattle
Alternatively, you can use TortoiseHg GUI.
Last Updated on Wednesday, 17 March 2010 02:22
+++++
I'm back ;)
Saturday, 06 March 2010 01:10administrator
Hi everyone!I
I didn't post here for pretty long time - we worked really hard on update of our own product. Now this part is finished, and we're going to spend some time on improving ORMeter (yes, we renamed it - you might notice it even by new header).
What's planned:
- Add collection performance tests (CRUD & simple bulk load tests)
- Add few more LINQ tests - see http://groups.google.ru/group/ormbattle-development/t/6dbeb2497f3544a9
- Implement HTML output mode for TestRunner. Currently it prints out text tables, and actually I hate converting them to Excel, and then - to nicely looking HTML with pictures. But if it would export HTML, relatively simple jQuery script + Google Chart API could make this manual conversion process unnecessary.
- Update the scorecard there using the most recent versions of all products.
- Likely, we'll do some minor changes related to design and scorecard layout.
I hope we'll be able to finish at least testing-related part of this plan in March 2010.
As usual, any opinions and ideas are welcome.
![]()
2010 Current Results
Friday, 30 July 2010
LINQ Implementation Scorecard:
Remarks
- Color bar: Green cells indicate better results; Red cells indicate worse results (the most "red" value is explicitly defined in Landmark column); Yellow cells indicate average results. Color bar is continuous, so all the intermediate colors can be used.
- LINQ in SubSonic is not tested - currently it is impossible to do this on our standard tests and model, because it does not support references.
Performance scorecard:

Remarks
- Color bar: Green cells indicate better results; Red cells indicate worse results (the most "red" value is explicitly defined in Landmark column); Yellow cells indicate average results. Color bar is continuous, so all the intermediate colors can be used.
- Above results are produced for 1000 item sequence. If you're interested in all the numbers, see complete ORMBattle.NET Test Suite output (for 50, 100, 1K, 5K, 10K and 30K item sequences).
- Cells with dashed frames indicate results produced either with exception to specialized API usage rule (CUD Multiple tests for BLToolkit and NHibernate), or results that are copied from nearby cells because of absence of API required by this test::
- Absence of native query \ materialization in LINQ to SQL. Or, better to say, LINQ is native API there. Thus results in these cells are copies of LINQ test results.
- Absence of compiled LINQ queries in NHibernate and SubSonic. Results there are copied from regular LINQ query tests.
Charts
Archived results:
- September 2009
- August 2009
- October 2009
![]()